Note
Click here to download the full example code
Repeated measures ANOVA
Based on [1].
Fixed effects ANOVA (independent measures, [1] p. 24):
Out:
Independent Measures

                SS   df      MS          F        p
---------------------------------------------------
A           112.00    2   56.00   22.62***   < .001
Residuals    52.00   21    2.48
---------------------------------------------------
Total       164.00   23
Repeated measures ANOVA ([1] p. 72): subject is defined as random effect
and entered for model construction as completely crossed factor
Out:
Repeated Measures

            SS   df      MS   MS(denom)   df(denom)          F        p
-----------------------------------------------------------------------
A       112.00    2   56.00        2.71          14   20.63***   < .001
-----------------------------------------------------------------------
Total   164.00   23
Two-way repeated measures ANOVA
y = Var([ 7,  3,  6,  6,  5,  8,  6,  7,
          7, 11,  9, 11, 10, 10, 11, 11,
          8, 14, 10, 11, 12, 10, 11, 12,
         16,  7, 11,  9, 10, 11,  8,  8,
         16, 10, 13, 10, 10, 14, 11, 12,
         24, 29, 10, 22, 25, 28, 22, 24])
a = Factor(['a0', 'a1'], repeat=3 * 8, name='A')
b = Factor(['b0', 'b1', 'b2'], tile=2, repeat=8, name='B')
subject = Factor(range(8), tile=6, name='subject', random=True)

print(test.anova(y, a * b * subject, title="Repeated Measure:"))
Out:
Repeated Measure:

             SS   df       MS   MS(denom)   df(denom)          F        p
-------------------------------------------------------------------------
A        432.00    1   432.00       10.76           7   40.14***   < .001
B        672.00    2   336.00       11.50          14   29.22***   < .001
A x B    224.00    2   112.00        6.55          14   17.11***   < .001
-------------------------------------------------------------------------
Total   1708.00   47
Bar-plot with within-subject error bars and pairwise tests
plot.Barplot(y, a % b, match=subject)
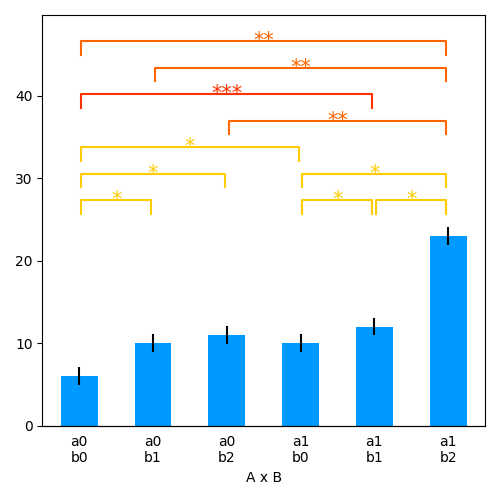
Out:
<Barplot: None ~ A x B>
