Note
Go to the end to download the full example code.
Model coding
Illustrates how to inspect coding of regression models.
Create a fixed effects model:
A + B + A % B
Show the model using dummy coding:
Create random effects model:
A + B + A % B + subject + A % subject + B % subject + A % B % subject
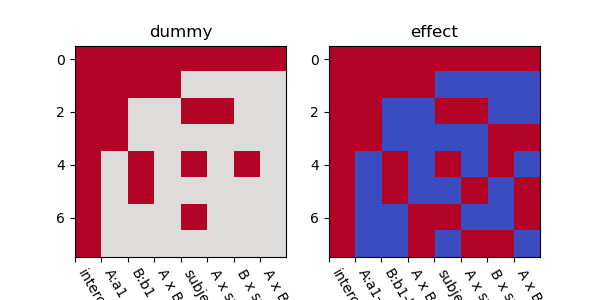
Show the model using dummy coding:
Or with effect coding:
m.as_table('effect')
Plot model matrix: