Note
Go to the end to download the full example code.
UTS-statistics (plot.UTSStat)
# sphinx_gallery_thumbnail_number = 5
from eelbrain import *


ds = datasets.simulate_erp(snr=1)
# add an orthogonal variable
ds['length'] = Factor(ds['n_chars'] > 4, labels={True: 'long', False: 'short'})
# smooth the data to make plots nicer
ds['cz'] = ds["eeg"].sub(sensor='Cz').smooth('time', 0.05)
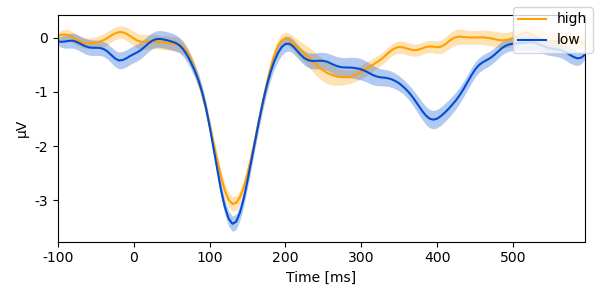
Plot the mean and SEM by condition:
p = plot.UTSStat('cz', 'predictability', data=ds, axh=3)
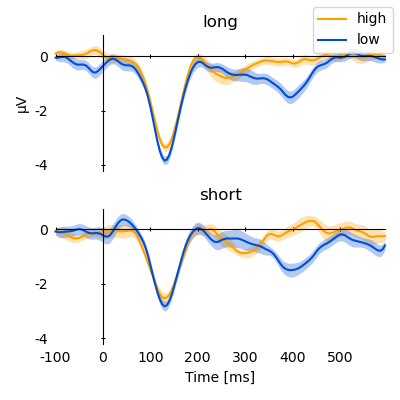
Split between different axes and use a t-frame:
p = plot.UTSStat('cz', 'predictability', 'length', data=ds, frame='t', axh=2)
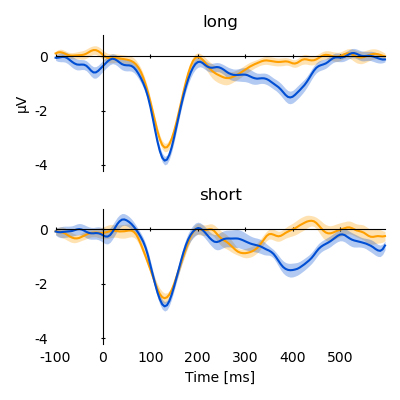
Colors can also be set using the within-plot category only:
colors = plot.colors_for_oneway(['high', 'low'])
p = plot.UTSStat("cz", 'predictability', 'length', data=ds, colors=colors, frame='t', legend=False, axh=2)
legend = plot.ColorList(colors)

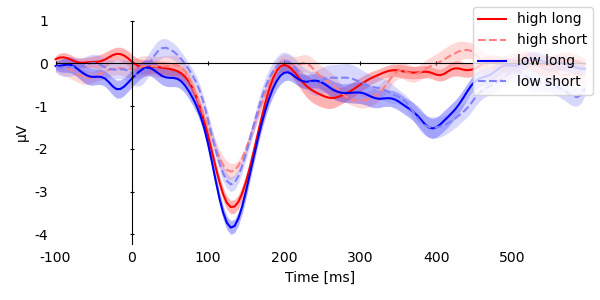
Plot all categories in the same plot. Make lines more distinguishable through line-style:
colors = {
    ('high', 'long'): plot.Style((1, 0, 0)),
    ('high', 'short'): plot.Style((1, 0.5, 0.5), linestyle='--'),
    ('low', 'long'): plot.Style((0, 0, 1)),
    ('low', 'short'): plot.Style((0.5, 0.5, 1), linestyle='--'),
}

p = plot.UTSStat("cz", 'predictability % length', data=ds, colors=colors, frame='t', top=1e-6, axh=3)