Repeated measures ANOVA

Repeated measures analysis of variance for univariate data.

Based on [1].

# Author: Christian Brodbeck <christianbrodbeck@nyu.edu>
from eelbrain import *

y = Var([7,  3,  6,  6,  5,  8,  6,  7,
         7, 11,  9, 11, 10, 10, 11, 11,
         8, 14, 10, 11, 12, 10, 11, 12],
        name='y')
a = Factor('abc', repeat=8, name='A')

Fixed effects ANOVA (independent measures, [1] p. 24):

test.ANOVA(y, a, title="Independent Measures")

Independent Measures

SS df MS F p
A 112.00 2 56.00 22.62*** < .001
Residuals 52.00 21 2.48
Total 164.00 23


Repeated measures ANOVA ([1] p. 72): subject is defined as random effect and entered for model construction as completely crossed factor

subject = Factor(range(8), tile=3, name='subject', random=True)
test.ANOVA(y, a * subject, title="Repeated Measures")

Repeated Measures

SS df MS MSdenom dfdenom F p
A 112.00 2 56.00 2.71 14 20.63*** < .001
Total 164.00 23


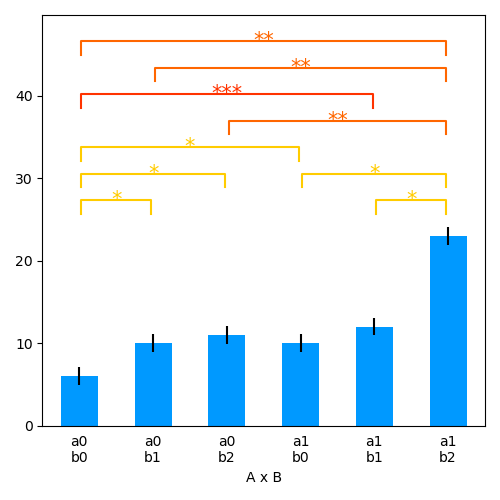
Two-way repeated measures ANOVA

y = Var([ 7,  3,  6,  6,  5,  8,  6,  7,
          7, 11,  9, 11, 10, 10, 11, 11,
          8, 14, 10, 11, 12, 10, 11, 12,
         16,  7, 11,  9, 10, 11,  8,  8,
         16, 10, 13, 10, 10, 14, 11, 12,
         24, 29, 10, 22, 25, 28, 22, 24])
a = Factor(['a0', 'a1'], repeat=3 * 8, name='A')
b = Factor(['b0', 'b1', 'b2'], tile=2, repeat=8, name='B')
subject = Factor(range(8), tile=6, name='subject', random=True)

test.ANOVA(y, a * b * subject, title="Repeated Measure:")

Repeated Measure:

SS df MS MSdenom dfdenom F p
A 432.00 1 432.00 10.76 7 40.14*** < .001
B 672.00 2 336.00 11.50 14 29.22*** < .001
A x B 224.00 2 112.00 6.55 14 17.11*** < .001
Total 1708.00 47


Bar-plot with within-subject error bars and pairwise tests

p = plot.Barplot(y, a % b, match=subject)
RMANOVA

References

Gallery generated by Sphinx-Gallery