Note
Go to the end to download the full example code.
Customizing plots
With the exception of plot.brain plots, Eelbrain’s plots are all based
on matplotlib. A lot of fine control over the plots can be achieved
through two means:
Customizing Matplotlib globally, before calling Eelbrain plotting functions, through styles or ``rcParams` <https://matplotlib.org/tutorials/ introductory/customizing.html#customizing-matplotlib-with-style-sheets-and-rcparams>`_
Accessing and modifying components of the plots after calling Eelbrain plotting functions
# sphinx_gallery_thumbnail_number = 3
from eelbrain import *
import matplotlib.style

ds = datasets.get_uv()
Styles
Matplotlib offers several styles
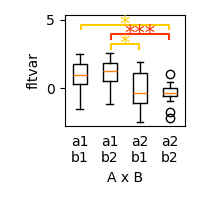
p = plot.Boxplot('fltvar', 'A % B', match='rm', data=ds, w=2)
# Apply a style
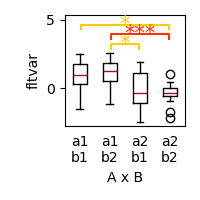
matplotlib.style.use('ggplot')
p = plot.Boxplot('fltvar', 'A % B', match='rm', data=ds, w=2)
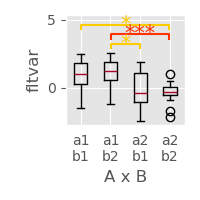
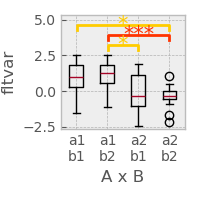
matplotlib.style.use('bmh')
p = plot.Boxplot('fltvar', 'A % B', match='rm', data=ds, w=2)
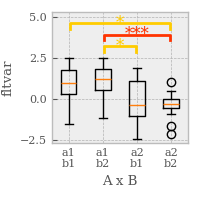
rcParams
Individual styles parameters can be modified directly in``rcParams``
matplotlib.rcParams['font.family'] = 'serif'
matplotlib.rcParams['font.size'] = 8
p = plot.Boxplot('fltvar', 'A % B', match='rm', data=ds, w=2)

# revert back to the default style
matplotlib.style.use('default')
Modifying components
Matplotlib can be used to fully customize a plot’s appearance by accessing
the underlying matplotlib.figure.Figure object through the plot’s
figure aatribute.
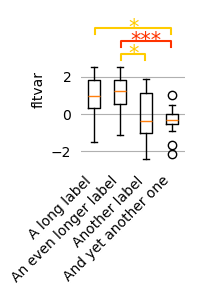
p = plot.Boxplot('fltvar', 'A % B', match='rm', data=ds, w=2)

p = plot.Boxplot('fltvar', 'A % B', match='rm', data=ds, w=2, h=3, xlabel=False)
ax = p.figure.axes[0]
ax.set_xticklabels(['A long label', 'An even longer label', 'Another label', 'And yet another one'], rotation=45, ha='right')
ax.grid(axis='y')
ax.set_yticks([-2, 0, 2])
ax.tick_params('y', left=False)
for spine in ax.spines.values():
    spine.set_visible(False)
p.figure.tight_layout()