Note
Go to the end to download the full example code.
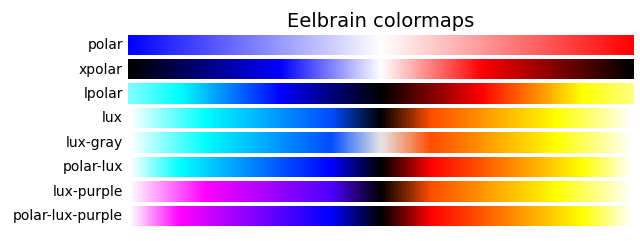
Eelbrain Colormaps
Eelbrain adds some colormaps to matplotlib’s standard colormaps.
In general, the colormaps come with an *-a (“alpha”) version which uses
transparency for low values instead of a solid color. For example, to use the
polar map with transparency, use polar-a.
import numpy as np
import matplotlib.pyplot as plt


gradient = np.linspace(0, 1, 256)
gradient = np.vstack((gradient, gradient))

cmap_list = [
    'polar',
    'xpolar',
    'lpolar',
    'lux',
    'lux-gray',
    'polar-lux',
    'lux-purple',
    'polar-lux-purple',
]

nrows = len(cmap_list)
figh = 0.35 + 0.15 + (nrows + (nrows-1)*0.1)*0.22
fig, axs = plt.subplots(nrows=nrows, figsize=(6.4, figh))
fig.subplots_adjust(top=1-.35/figh, bottom=.15/figh, left=0.2, right=0.99)

axs[0].set_title('Eelbrain colormaps', fontsize=14)

for ax, name in zip(axs, cmap_list):
    ax.imshow(gradient, aspect='auto', cmap=name)
    ax.text(-.01, .5, name, va='center', ha='right', fontsize=10,
            transform=ax.transAxes)

for ax in axs:
    ax.set_axis_off()