Note
Click here to download the full example code
Boxplot
Much of the functionality is shared with plot.Barplot.
# %matplotlib inline
from eelbrain import *
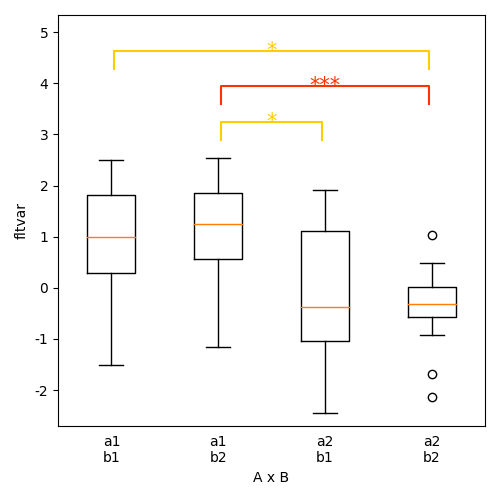
Basic boxplot
ds = datasets.get_uv()
ds.summary()
p = plot.Boxplot('fltvar', 'A % B', match='rm', ds=ds)
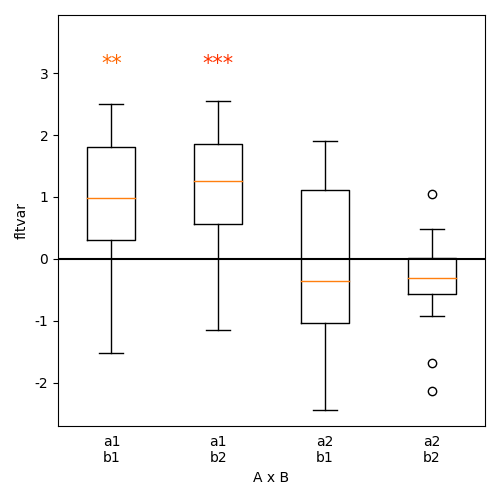
Test against population mean
Instead of pairwise tests, test the values in each category against a population mean. Use the test parameter to set the value to test against. In the example, test=0 will test whether each sample is significantly different form zero. Use the tail parameter to determine the tailedness of the test (tail=1 to test for a value greater than 0).
p = plot.Boxplot('fltvar', 'A % B', match='rm', ds=ds, test=0, tail=1)
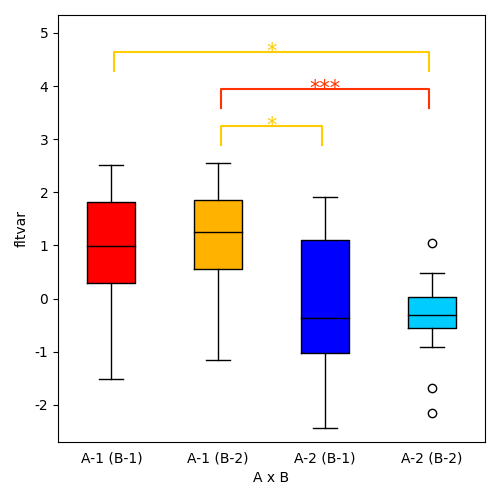
Appearance: colored boxes and category labels
colors = {
('a1', 'b1'): (1.0, 0.0, 0.0),
('a1', 'b2'): (1.0, 0.7, 0.0),
('a2', 'b1'): (0.0, 0.0, 1.0),
('a2', 'b2'): (0.0, 0.8, 1.0),
}
labels = {
('a1', 'b1'): 'A-1 (B-1)',
('a1', 'b2'): 'A-1 (B-2)',
('a2', 'b1'): 'A-2 (B-1)',
('a2', 'b2'): 'A-2 (B-2)',
}
p = plot.Boxplot('fltvar', 'A % B', match='rm', ds=ds, colors=colors, xticks=labels)
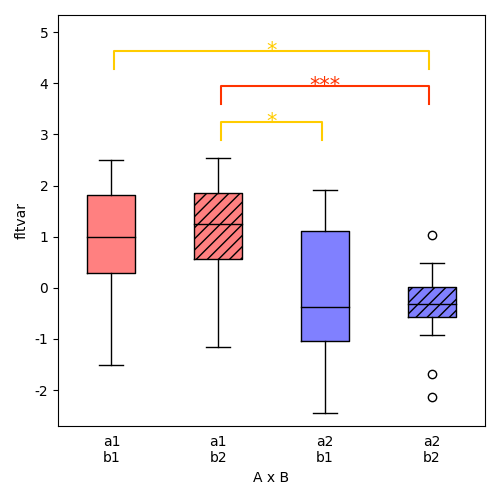
colors = {
('a1', 'b1'): plot.Style((1, .5, .5), hatch=''),
('a1', 'b2'): plot.Style((1, .5, .5), hatch='///'),
('a2', 'b1'): plot.Style((.5, .5, 1), hatch=''),
('a2', 'b2'): plot.Style((.5, .5, 1), hatch='///'),
}
p = plot.Boxplot('fltvar', 'A % B', match='rm', ds=ds, colors=colors)
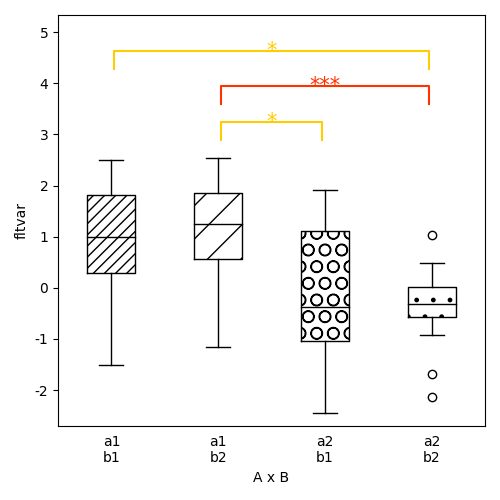
colors = {
('a1', 'b1'): plot.Style('w', hatch='///'),
('a1', 'b2'): plot.Style('w', hatch='/'),
('a2', 'b1'): plot.Style('w', hatch='O'),
('a2', 'b2'): plot.Style('w', hatch='.'),
}
p = plot.Boxplot('fltvar', 'A % B', match='rm', ds=ds, colors=colors)
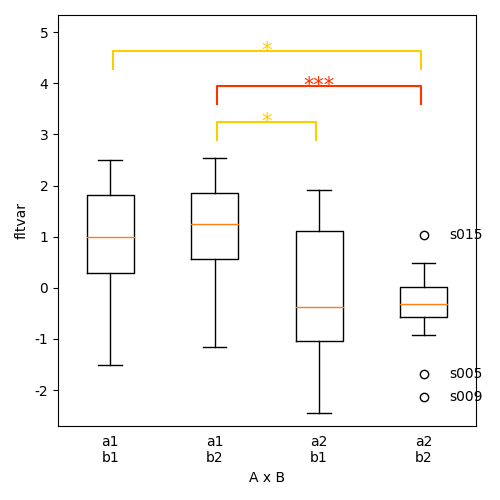
Label fliers
The label_fliers=True option is used to identify outlier points (labels are based on the match argument).
p = plot.Boxplot('fltvar', 'A % B', match='rm', ds=ds, label_fliers=True)