Note
Click here to download the full example code
Generate NDVar (with artificial data)
Shows how to initialize an NDVar with the structure of EEG data from
(randomly generate) data arrays. The data is intended for illustrating EEG
analysis techniques and meant to vaguely resemble data from an N400 experiment,
but it is not meant to be a physiologically realistic simulation.
# sphinx_gallery_thumbnail_number = 2
import numpy as np
import scipy.spatial
from eelbrain import *
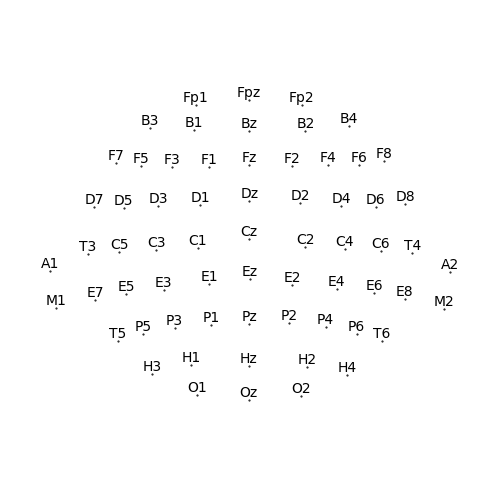
Create a Sensor dimension from an actual montage
sensor = Sensor.from_montage('standard_alphabetic')
p = plot.SensorMap(sensor)
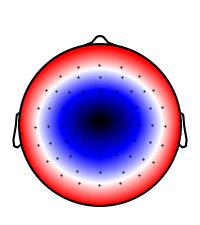
Generate N400-like topography
i_cz = sensor.names.index('Cz')
cz_loc = sensor.locs[i_cz]
dists = scipy.spatial.distance.cdist([cz_loc], sensor.locs)[0]
dists /= dists.max()
topo = -0.7 + dists
n400_topo = NDVar(topo, sensor)
p = plot.Topomap(n400_topo, clip='circle')
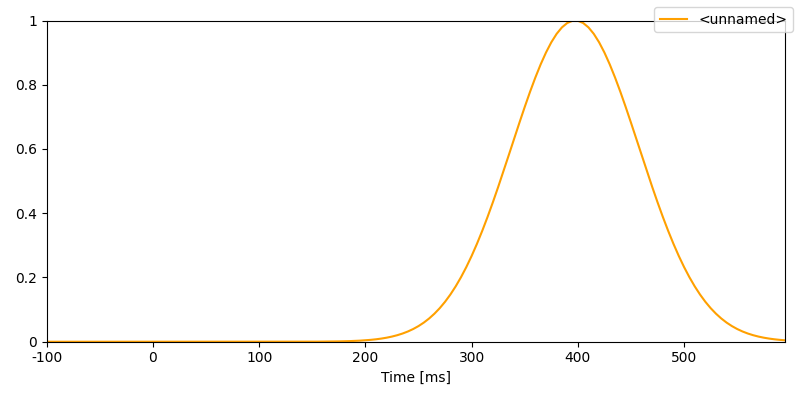
Generate N400-like timing
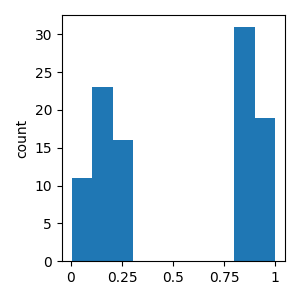
Generate random values for the independent variable (call it “cloze probability”)
Put all the dimensions together to simulate the EEG signal
signal = (1 - cloze) * n400_timecourse * n400_topo

# Add noise
noise = powerlaw_noise(signal, 1)
noise = noise.smooth('sensor', 0.02, 'gaussian')
signal += noise

# Apply the average mastoids reference
signal -= signal.mean(sensor=['M1', 'M2'])

# Store EEG data in a Dataset with trial information
ds = Dataset()
ds['eeg'] = signal
ds['cloze'] = Var(cloze_x)
ds['cloze_cat'] = Factor(cloze_x > 0.5, labels={True: 'high', False: 'low'})
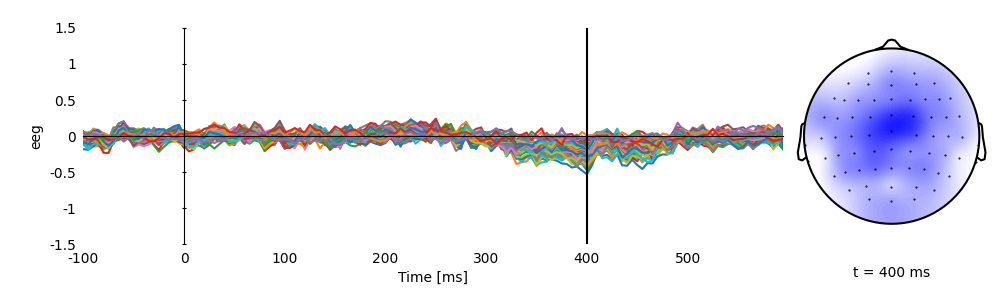
Plot the average simulated response
p = plot.TopoButterfly('eeg', ds=ds, vmax=1.5, clip='circle', frame='t', axh=3)
p.set_time(0.400)
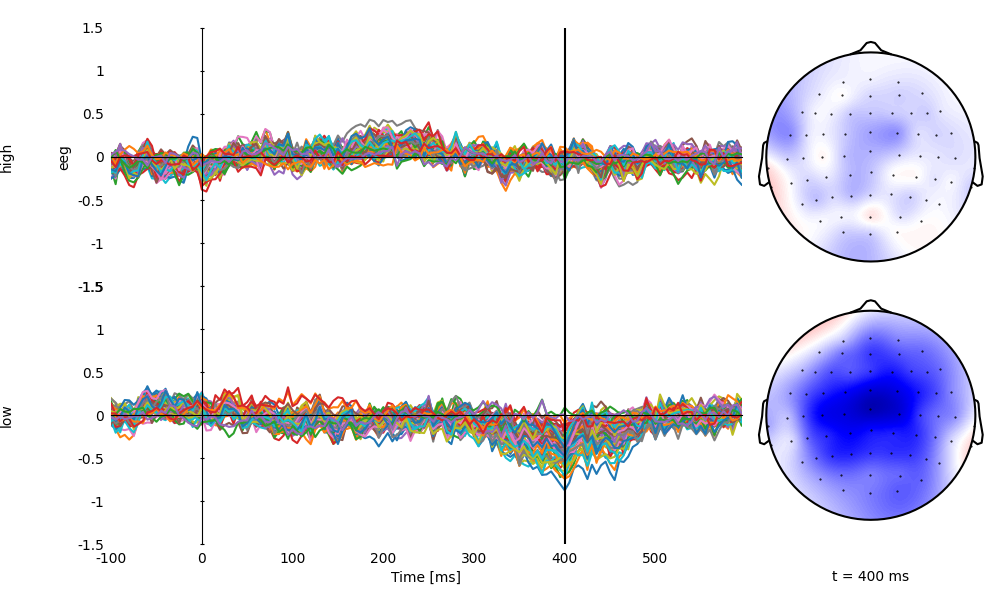
Plot averages separately for high and low cloze
p = plot.TopoButterfly('eeg', 'cloze_cat', ds=ds, vmax=1.5, clip='circle', frame='t', axh=3)
p.set_time(0.400)
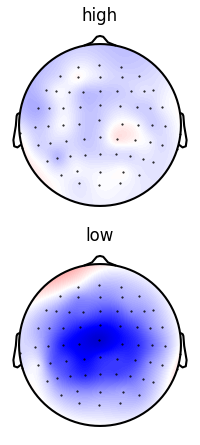
Average over time in the N400 time window
p = plot.Topomap('eeg.mean(time=(0.300, 0.500))', 'cloze_cat', ds=ds, vmax=1, clip='circle')
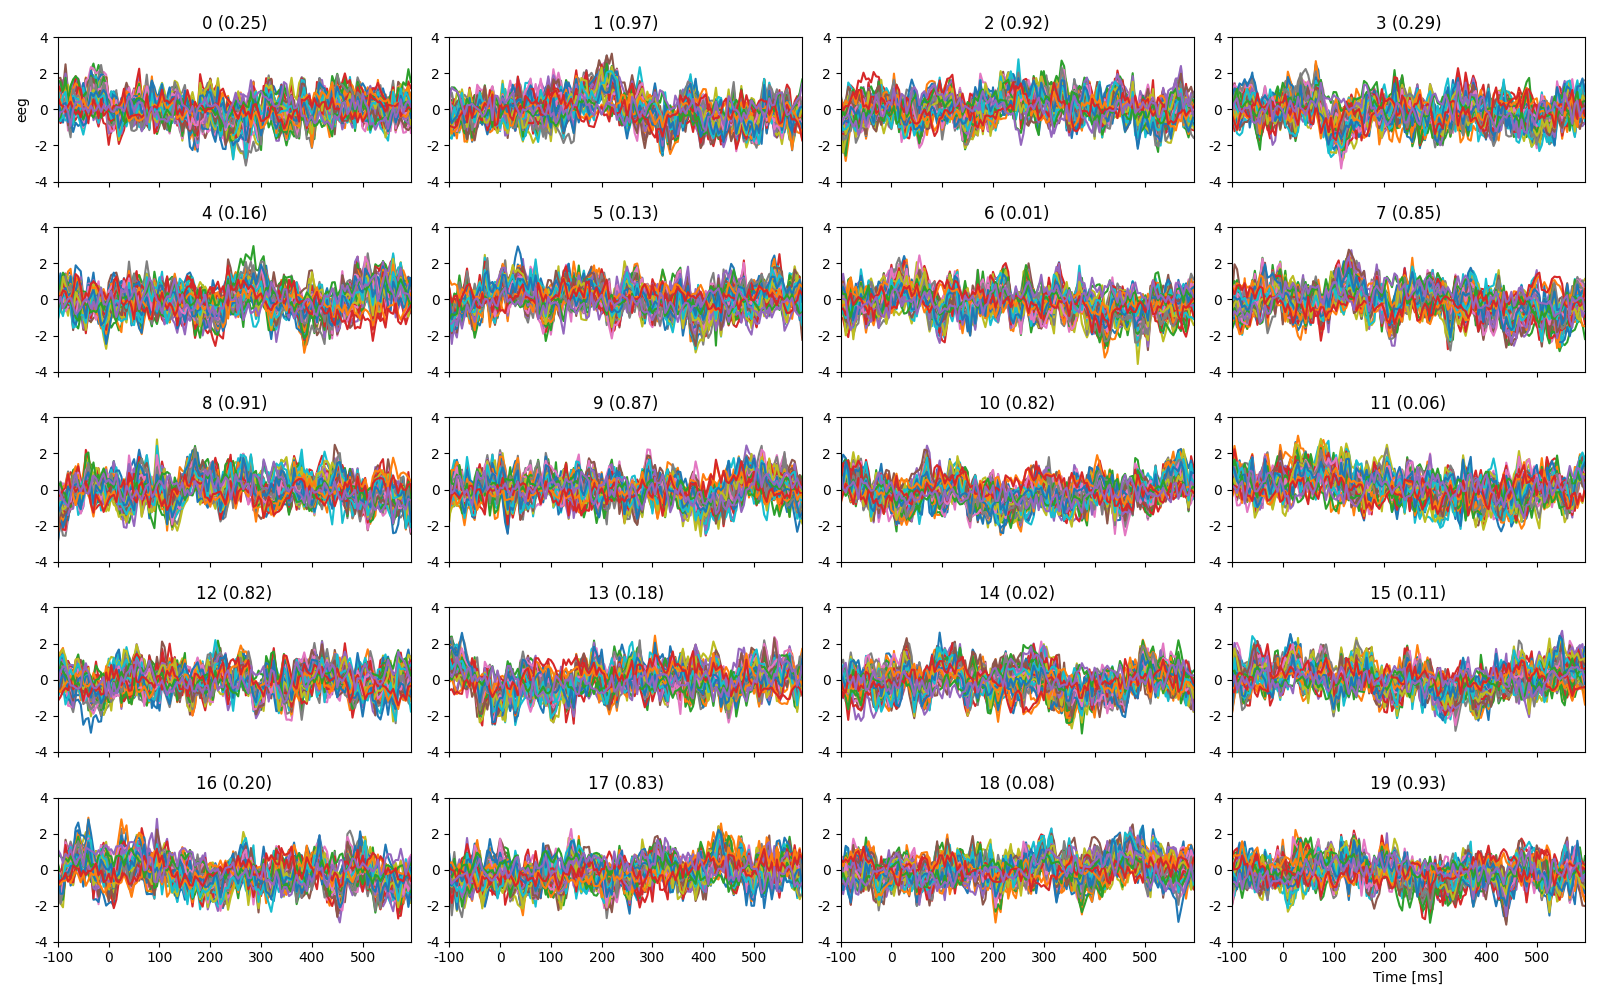
Plot the first 20 trials, labeled with cloze propability
Total running time of the script: ( 0 minutes 8.356 seconds)
