Note
Go to the end to download the full example code.
Group level analysis
Datasets provide a means to collect data for statistical
analysis.
A Dataset is similar to a dataframe in R or pandas,
but can hold mass-univariate measurements in NDVars.
This example illustrates how to construct a Datasets
by first collecting the cases, or rows, of the desired data table,
and then combining them using Dataset.from_caselist().
Simulating subject data
This example uses simulated EEG data to illustrate that.
We will use the simulated EEG data to derive a general input structure for creating group level datasets: A list of condition labels and corresponding (simulated) EEG responses.
Average the data by condition to get two condition averages per subject:
data_by_condition = data.aggregate('predictability')
data_by_condition
Turn this into the general label/brain response structure:
subject_data = list(data_by_condition.zip('predictability', 'eeg'))
subject_data
[('high', <NDVar 'eeg': 140 time, 65 sensor>), ('low', <NDVar 'eeg': 140 time, 65 sensor>)]
Construct group level data
Use the procedure described above to simulate a group level dataset.
We collect the labels (subject and condition labels) and brain responses in
a list (cases).
Each entry in this list corresponds to one row of the desired Dataset:
cases = []  # list of rows
for subject in range(10):
    data = datasets.simulate_erp(seed=subject)
    data_by_condition = data.aggregate('predictability')
    for predictability, eeg in data_by_condition.zip('predictability', 'eeg'):
        cases.append([str(subject), predictability, eeg])

cases
[['0', 'high', <NDVar 'eeg': 140 time, 65 sensor>], ['0', 'low', <NDVar 'eeg': 140 time, 65 sensor>], ['1', 'high', <NDVar 'eeg': 140 time, 65 sensor>], ['1', 'low', <NDVar 'eeg': 140 time, 65 sensor>], ['2', 'high', <NDVar 'eeg': 140 time, 65 sensor>], ['2', 'low', <NDVar 'eeg': 140 time, 65 sensor>], ['3', 'high', <NDVar 'eeg': 140 time, 65 sensor>], ['3', 'low', <NDVar 'eeg': 140 time, 65 sensor>], ['4', 'high', <NDVar 'eeg': 140 time, 65 sensor>], ['4', 'low', <NDVar 'eeg': 140 time, 65 sensor>], ['5', 'high', <NDVar 'eeg': 140 time, 65 sensor>], ['5', 'low', <NDVar 'eeg': 140 time, 65 sensor>], ['6', 'high', <NDVar 'eeg': 140 time, 65 sensor>], ['6', 'low', <NDVar 'eeg': 140 time, 65 sensor>], ['7', 'high', <NDVar 'eeg': 140 time, 65 sensor>], ['7', 'low', <NDVar 'eeg': 140 time, 65 sensor>], ['8', 'high', <NDVar 'eeg': 140 time, 65 sensor>], ['8', 'low', <NDVar 'eeg': 140 time, 65 sensor>], ['9', 'high', <NDVar 'eeg': 140 time, 65 sensor>], ['9', 'low', <NDVar 'eeg': 140 time, 65 sensor>]]
This list can now be turned into a Dataset:
data = Dataset.from_caselist(['subject', 'predictability', 'eeg'], cases, random='subject')
data.head()
Averaging by condition
In a dataset that contains condition labels, these labels can be used to derive averages by condition:
data_by_condition = data.aggregate('predictability', drop_bad=True)
data_by_condition
This could be used to retrieve those average responses:
data_by_condition[0, 'eeg']
<NDVar 'eeg': 140 time, 65 sensor>
The grand average could be derived by aggregating without a model, resulting in a single row:
data.aggregate(drop_bad=True)
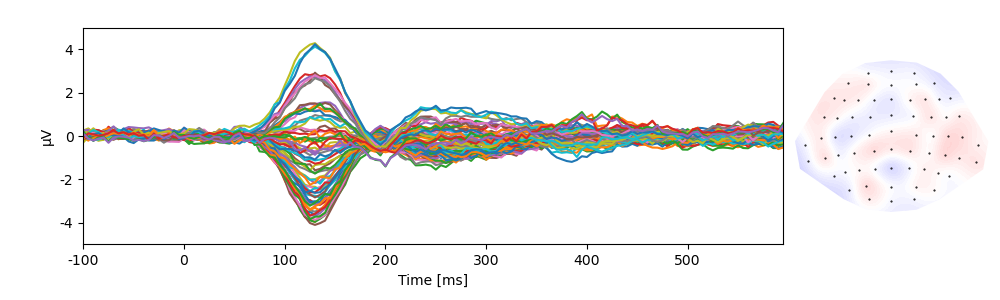
Many functions automatically average across cases …
p = plot.TopoButterfly('eeg', data=data)
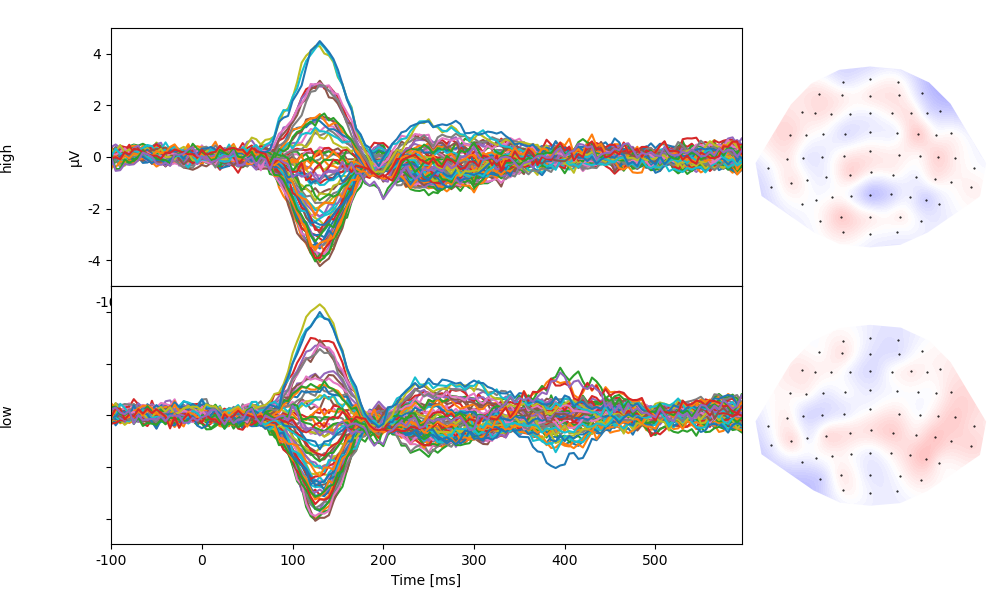
… and directly accept a parameter for averaging by condition:
p = plot.TopoButterfly('eeg', 'predictability', data=data)
Models can similarly be used to define conditions in statistical tests:
<TTestRelated 'eeg', 'predictability', 'high', 'low', 'subject' (n=10), samples=1023, p = .009>